Use this information to manage and monitor various aspects of Sync Service.
There are a number of areas that can be monitored, including:
- The ActiveMQ topic that is used to relay events from the repository to the Sync Service.
- The health of the Sync Service.
The health of the topic can be monitored using JMX and ActiveMQ advisories.
JMX
Make sure that JMX is enabled in ActiveMQ. For more information, see ActiveMQ - JMX.
ActiveMQ provides a publish/subscribe mechanism to relay node events from the repository to the Sync Service. The JMX beans that exposes information on the node events topic is:
org.apache.activemq:type=Broker,brokerName=localhost,destinationType=Topic,
destinationName=alfresco.repo.event2
The Sync Service consumes from a queue that is tied to the virtual topic. The JMX bean name of this queue is:
org.apache.activemq:type=Broker,brokerName=localhost,destinationType=Queue,
destinationName=Consumer.<SyncId>.alfresco.repo.event2
where <SyncId> is a UUID that uniquely represents the Sync Service. This UUID can be obtained from the Sync Service health check.
Configure and Monitor Advisories
ActiveMQ supports advisory messages or advisories which are added to a standard topic when something happens in ActiveMQ, for example, when a message is consumed or if a message is discarded.
Advisories can be read like any other topic. The following advisories can be useful to monitor:
sendAdvisoryIfNoConsumers(for the node events, this advisory is not sent because events are persistent)advisoryForSlowConsumersadvisdoryForFastProducersadvisoryForDiscardingMessagesadvisoryWhenFull
The advisories can be configured in the activemq.xml file as follows:
<policyEntry topic="alfresco.repo.event2" advisoryForDelivery="true"
advisoryForConsumed="true" advisoryForSlowConsumers="true" sendAdvisoryIfNoConsumers="true"
advisoryForFastProducers="true">
For more information, see Handling Advisory Messages.
Sync Service health check
The Sync Service exposes a collection of health checks that are useful in managing the Sync Service. The health checks include the status of the Sync Service’s ActiveMQ, database, and repository connections.
The Sync Service health check can be accessed using JMX (bean health) or a REST call:
GET https://localhost:9090/alfresco/healthcheck
The output is something like:
{
  "activeMQConnection": {
    "healthy": true,
    "message": "ActiveMQ connection Ok",
    "duration": 0,
    "timestamp": "2023-06-27T13:42:12.250Z"
  },
  "databaseConnection": {
    "healthy": true,
    "message": "Database connection Ok",
    "duration": 0,
    "timestamp": "2023-06-27T13:42:12.250Z"
  },
  "deadlocks": {
    "healthy": true,
    "duration": 3,
    "timestamp": "2023-06-27T13:42:12.454Z"
  },
  "eventsHealthCheck": {
    "healthy": true,
    "message": "Ok",
    "duration": 4,
    "timestamp": "2023-06-27T13:42:12.450Z"
  },
  "minimumClientVersion": {
    "healthy": true,
    "message": "1.0.1",
    "duration": 0,
    "timestamp": "2023-06-27T13:42:12.250Z"
  },
  "repositoryConnection": {
    "healthy": true,
    "message": "Repository connection Ok",
    "duration": 194,
    "timestamp": "2023-06-27T13:42:12.445Z"
  },
  "syncServiceIdCheck": {
    "healthy": true,
    "message": "0abd879e-bdc0-30be-8622-86e3f71f59a6",
    "duration": 7,
    "timestamp": "2023-06-27T13:42:12.250Z"
  },
  "versionCheck": {
    "healthy": true,
    "message": "    3.10.0 (2023-04-28T12:18:27Z)",
    "duration": 0,
    "timestamp": "2023-06-27T13:42:12.250Z"
  }
}
This table describes each part of the health check.
| Elements | Description |
|---|---|
| “eventsHealthCheck” : { “healthy” : true, “message” : “Ok” }, | This specifies the health of the repository events tracking mechanism. It relies on the nodeEventLag.99thPercentile metric. This defines the time taken for events sent by the repository to be consumed by the Sync Service. It returns false if nodeEventLag.99thPercentile/1000000000 > sync.health.events.eventLagTolerance (default value is 5000ms). If false this could mean that it’s flooded with more events than the Sync Service can consume. It may take more than 5 seconds for an event to travel from Alfresco Content Services to Sync Service (via ActiveMQ). Also, check for clues in the Sync Service logs to see if it’s unable to consume specific events. This makes ActiveMQ retry delivery, hence the increased nodeEventLag. |
| “activeMQConnection” : { “healthy” : true, “message” : “ActiveMQ connection Ok” }, | This specifies that the connection to ActiveMQ is healthy. |
| “repositoryConnection” : { “healthy” : true, “message” : “Repository connection Ok” }, | This specifies that the Sync Service can connect to Alfresco, for example, hostname and port in config.yml. |
| “databaseConnection” : { “healthy” : true, “message” : “Database connection Ok” }, | This specifies that the Sync Service is connected to the database and making successful SQL calls. |
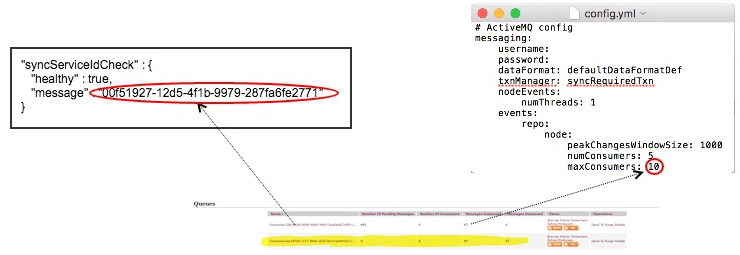
| “syncServiceIdCheck” : { “healthy” : true, “message” : “00f51927-12d5-4f1b-9979-287fa6fe2771” } | This specifies the ID used in the connection to ActiveMQ to identify itself to the queue. |
| “deadlocks” : { “healthy” : true }, | All Dropwizard applications ship with the deadlocks health check installed by default, which uses the Java 1.6 built-in thread deadlock detection to determine if any threads are deadlocked. |
| “minimumClientVersion”: { “healthy”: true, “message”: “1.0.1” }, | Specifies if the dsync.client.version.min has been specified in alfresco-global.properties. |
The following diagram shows the ActiveMQ queue consumer list. Here, the consumer name relates to the syncServiceIdCheck - message. Also, the Number of Consumers relates to the maxConsumers property which is specified in the config.yml file.
Logging
The config.yml file contains the logging information.
logging:
  level: INFO
  loggers:
    "org.alfresco.service.common.auth": WARN
    "org.apache.activemq": WARN
    "com.sun.jersey.api.container.filter.LoggingFilter": WARN
    "org.alfresco.service": INFO
  appenders:
    - type: console
      threshold: ALL
      timeZone: UTC
      target: stdout
      logFormat: "%-5level [%d{yyyy-MM-dd HH:mm:ss.SSS}] [%thread] %logger - %msg%n"
    - type: file
      threshold: ALL
      timeZone: UTC
      currentLogFilename: ./logs/sync-service.log
      archive: true
      archivedLogFilenamePattern: ./logs/sync-service-%d.log.gz
      archivedFileCount: 5
      logFormat: "%-5level [%d{yyyy-MM-dd HH:mm:ss.SSS}] [%thread] %logger - %msg%n"
Sync Service metrics
The Sync Service exposes a collection of metrics that are useful in managing the Sync Service. These metrics can be accessed using JMX (see bean metrics) or a REST call:
GET https://localhost:9090/alfresco/api/-default-/private/alfresco/versions/1/metrics
The response is JSON and contains all the metrics collected by the Sync Service. In particular:
| Metric Name | Type | Description |
|---|---|---|
| nodeEventLag | Timer (*) | Specifies the time taken for events sent by the repository to be consumed by the Sync Service. It is measured in milliseconds. |
| nodeEventsBrokerTime | Timer | Specifies the amount of time the event spends in the (ActiveMQ) broker. |
| nodeEventBrokerLag | Timer | Specifies the lag between events being sent to the (ActiveMQ) broker by the repository and the time at which the broker receives the event. |
| nodeEventConsumerLag | Timer | Specifies the lag between the broker sending out events and the Sync Service consuming them. |
| lagBetweenEventCreateAndSend | Timer | Specifies the lag between the event creation time and the time the event is sent to the (ActiveMQ) broker. |
| syncsTimedOut | Meter (**) | Specifies the syncs that have timed out (possibly due to long query times). |
| syncFailuresMeter | Meter | Specifies the sync failures. |
| syncsTimer | Timer | Specifies the distribution of sync times. |
| timePerCommit | Timer | Specifies the node event database commit times. |
| timePerEventUpdate | Timer | Specifies the node event database insert times. |
| timePerGetChanges | Timer | Specifies the sync query times. |
| numActiveClusterMembers | Gauge (***) | Number of active Sync Service cluster members. |
(*) Timer measures the rate that a particular piece of code is called and the distribution of its duration. See Timers.
(**) Meter measures the rate of events over time, for example, requests per seconds. See Meters.
(***) Gauge is an instantaneous measurement of a value. See Gauges.
Reporting Sync Service metrics to Graphite
In order to visualize the metrics listed above in a graphical manner, Sync Service can be configured to report all its metrics to Graphite. See the sync.metrics.reporter.graphite.* properties in Configure the Sync Service.
Here you can see a glimpse of how the timePerCommit metric looks like in Graphite:

If one or more Sync Service instances form a cluster, the same metric is reported in the graph as an averaged value.