Visualize metrics with Grafana
Grafana is one of many tools that allows you to pull data from Graphite, and allows you to create more customizable, and attractive charts and graphs. You may find your own preferred tool. Here are a couple of Sync Service metrics displayed in Grafana:

You can create your own dashboard view with various charts and graphs in Grafana by using the following steps.
Add a Graphite data source
Use these instructions to add a data source from Graphite to use with Grafana.
-
Open your browser and enter
http://<Grafana-host>:3000. -
Click + Add data source.
-
Enter a Name for this data source.
-
Select Graphite from the Type menu.
-
Input the URL of the Graphite server.
If you’re using a proxy, input an IP address that’s accessible from the Grafana backend. For example, use the subnet private IP when deployed in AWS:
http://10.0.2.243:80If you have a direct connection, enter a publicly accessible IP:
http://34.240.113.207:80 -
Use
Basic Authto start with. Graphite’s default user and password areroot:root. -
Click Save & Test.
You should see the message:
Data source is working.
Create your first dashboard
Use these instructions to create your first dashboard in Grafana, and start creating graphs/charts.
-
Open your browser and enter
http://<Grafana-host>:3000. -
Click Create your first dashboard.
-
Add a new graph by selecting a graph type:
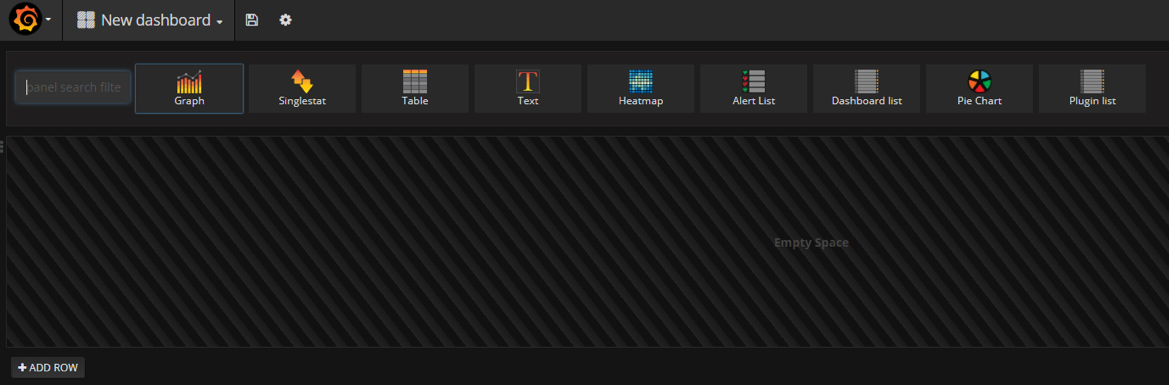
-
Click Panel Title > Edit to select the metric to display in this graph:
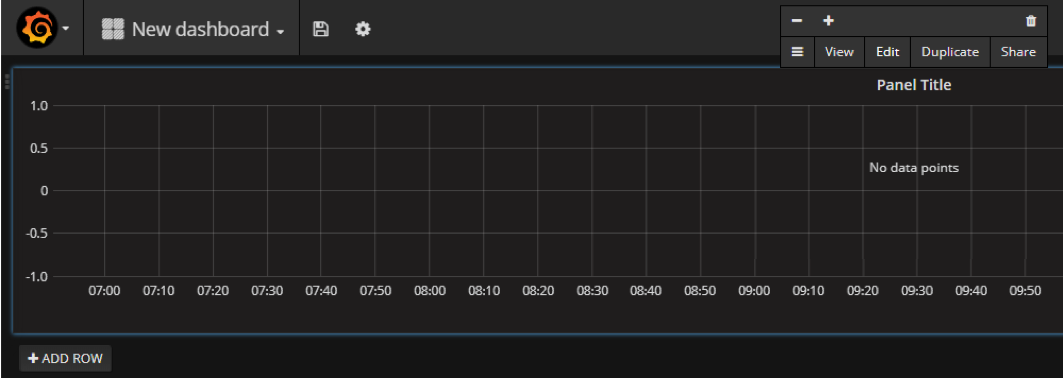
-
In the Metrics tab, select the Graphite Data Source, and the value of the metric to display (such as the mean, 99th percentile, etc.).
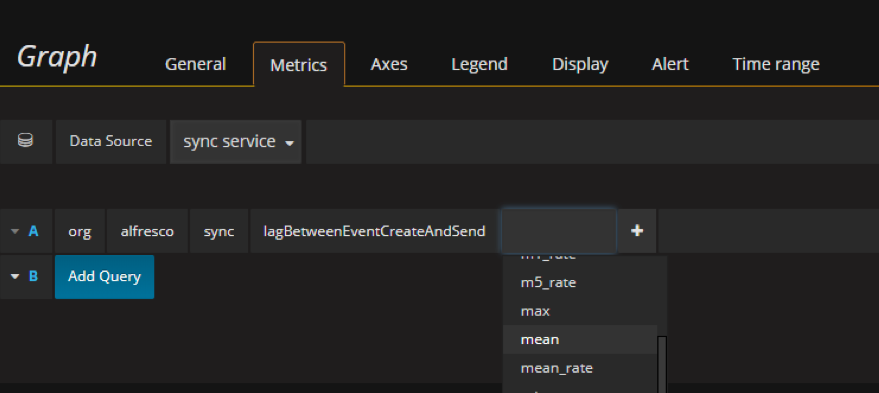
-
Click the disk icon
 to save the dashboard.
If you’ve previously saved a dashboard, you can import it using the following steps.
Import an existing dashboard
Use these instructions to import an existing dashboard into Grafana.
You can import a dashboard that you saved as part of creating your first dashboard.
-
Open your browser and enter
http://<Grafana-host>:3000. -
Click Dashboards then Import:

-
Find the file you saved in step 6 of Create your first dashboard then import it.